What’s on the page
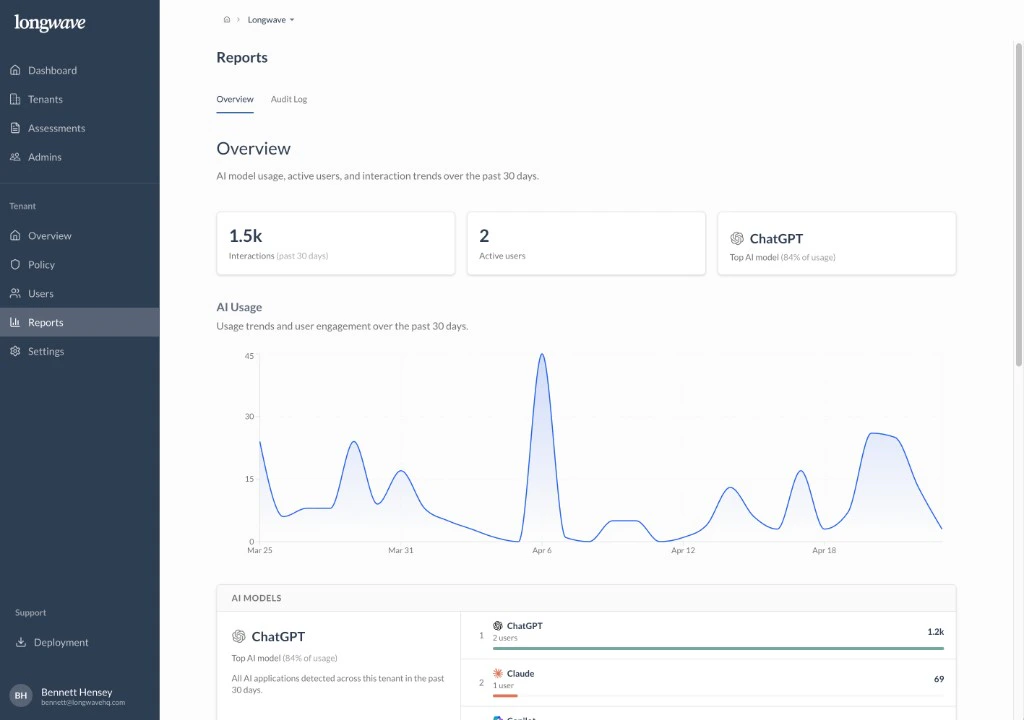
- Interactions (past 30 days). The headline number. How much AI activity the customer’s people generated this month.
- Active users. How many distinct people actually used AI. Often smaller than the customer assumes.
- Top AI model. The single AI app dominating usage, with its share of total interactions.
- AI Usage chart. A 30-day trend line so you can spot spikes, weekend patterns, and growth.
- AI models list. The ranked leaderboard of every AI app Longwave saw, with users and interactions per app.
Use it to set the scene
Open the Overview report first in any client meeting. It establishes three things in under a minute:- AI is happening here. The interaction count, in their environment, with their people’s names on it.
- It’s concentrated. Usually one or two tools account for most of it. This is the first cue toward an Approved-app conversation.
- There’s a long tail. The model list almost always includes apps the customer didn’t know were in use. That’s the cue toward conditional access and the Audit Log.